energy independence statistics 2026

Energy Independence Statistics 2026: Home Backup Power Trends

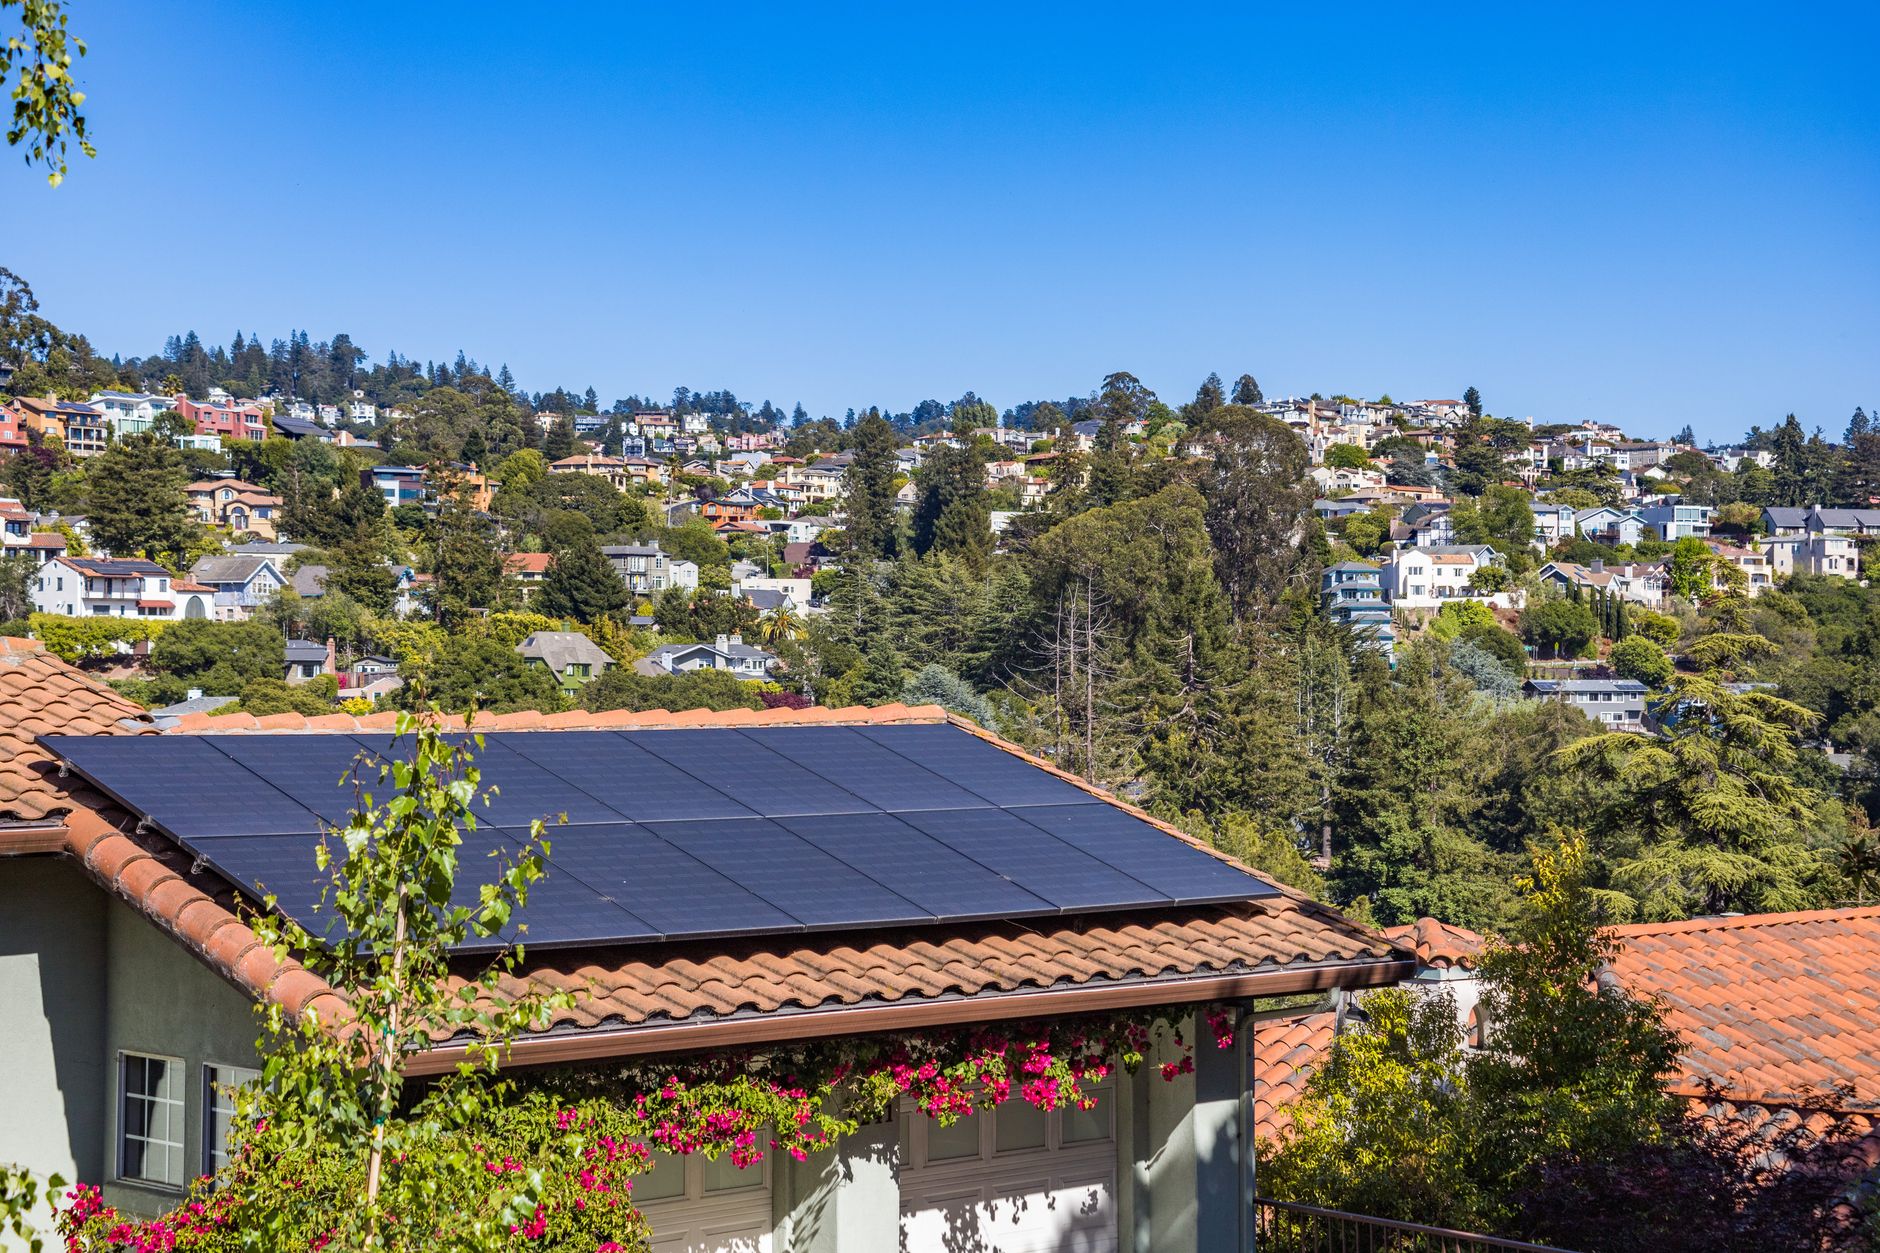
Energy independence is no longer a fringe goal. Homeowner interest in energy independence surged after major 2020s outages. Solar-plus-storage is now the fastest-growing residential energy segment. Backup power ranks as a top home-improvement motivator for rural homeowners, according to our best home backup power 2026 review. The post-2020s outage pattern changed how homeowners evaluate energy resilience. A rural homeowner no longer treats backup power as a luxury. It has become a practical response to longer restoration times and wider weather-related failures. Solar panels for home backup can reduce dependence on utility infrastructure, but they require battery storage to cover nighttime loads. Natural Resources Canada tracks grid reliability and energy policy data that show rural grids face higher outage exposure. ...
August 16, 2026 · 4 min · Jarrod Gravison
electric grid vulnerability statistics 2026

Electric Grid Vulnerability Statistics 2026: Outage and Backup Trends

Electric grid vulnerability is no longer a regional problem. Aging infrastructure and extreme weather are the top drivers of rising outage rates across North America. Utilities face billions in grid-hardening investment needs, but those upgrades will not happen quickly. Homeowners are responding by pairing battery storage with solar, as explored in our best home backup power options for 2026. These trends point to a widening reliability gap. Grid operators can upgrade transmission lines and substations, but extreme weather events are arriving faster than many planned capital projects. The U.S. Energy Information Administration tracks outage duration and frequency data that show the same pattern: fewer customers experience routine outages, but severe weather outages are larger and longer. For homeowners, that means a portable generator may cover a short blackout, while a multiday event requires more planning. ...

August 16, 2026 · 4 min · Jarrod Gravison
solar panel cost statistics 2026

Solar Panel Cost Statistics 2026: Prices, Incentives, Backup Power

Solar panel costs have fallen roughly 90% since 2010. U.S. residential systems now average $2.70 to $3.30 per watt before incentives in 2025. Federal and provincial incentives cut net installed cost further. Homeowners comparing solar panels for home backup should treat these figures as a planning baseline. The cost per watt matters because it sets the budget for a solar array sized for outage resilience. A home backup system usually pairs solar with batteries. Lower panel prices make the solar portion cheaper, but storage and installation still dominate total project cost. According to Natural Resources Canada, incentive programs vary by province and can reduce payback periods significantly. ...

August 16, 2026 · 4 min · Jarrod Gravison
residential solar statistics 2026

Residential Solar Statistics 2026: U.S. Records and Canadian Hotspots

Residential solar statistics for 2026 start with a meaningful record: U.S. residential solar capacity hit an all-time annual high in 2024, according to SEIA. More of those new systems than ever included battery storage. In Canada, most residential solar capacity sits in Ontario, Alberta, and British Columbia. Homeowners planning solar panels for home backup should read these figures carefully. The record U.S. residential solar year matters because generation is not the same as outage protection. A grid-tied solar array will not power a home during a blackout unless it is paired with storage or a battery-backed inverter. This explains why rising attachment rates are important. Homeowners adding storage can use whole-house battery backup for critical loads. For shorter, portable needs, a best solar generator can handle small circuits. ...

August 16, 2026 · 3 min · Jarrod Gravison
power outage cost statistics 2026

Power Outage Cost Statistics 2026: Economic and Household Impact

U.S. power outages cost the economy about $150 billion annually, according to DOE estimates. Per-outage business losses run thousands of dollars in lost productivity. Residential food loss alone can reach hundreds of dollars per extended outage. For home backup options that reduce these risks, see best home backup power 2026. The $150 billion annual figure matters because it accumulates through small, repeating losses. A single household or business may not see the full national impact, but thousands of events create the total. Grid reliability data from the EIA shows that outages remain frequent enough to make planning worthwhile. ...

August 16, 2026 · 3 min · Jarrod Gravison
home generator market statistics 2026

Home Generator Market Statistics 2026: Demand and Backup Trends

The home generator market in 2026 sits inside a larger global generator market projected to grow from about $29.6 billion in 2023 toward $45.1 billion by 2030. Storm-driven outages remain the strongest demand trigger for residential standby units. Inverter generators continue taking share from conventional portables because they run quieter and produce cleaner power. See best home backup power options for 2026 before choosing equipment. The 2023 to 2030 global generator forecast matters because it frames 2026 as a steady, mid-cycle year rather than an outlier. Homeowners planning a backup system should not wait for a dramatic price collapse. The main cost variable is installation and fuel, not the generator core unit. Our how to size a generator for your home guide walks through the load calculation that drives the final quote. ...

August 16, 2026 · 4 min · Jarrod Gravison
home battery storage statistics 2026

Home Battery Storage Statistics 2026: U.S. Growth and Prices

Home battery storage in the United States entered 2025 with strong momentum after a record 2024. Q1 2025 grew about 57 percent year over year. Global pack prices fell below $100 per kilowatt-hour in 2024. For an updated comparison, see the best home backup power options for 2026. The growth number matters because falling pack prices change the math for a typical home. A 13.5 kilowatt-hour battery now costs less than it did two years ago. That shifts backup power decisions away from generators alone. Homeowners should compare whole house battery backup with traditional standby units. ...

August 16, 2026 · 3 min · Jarrod Gravison
grid failure statistics 2026

Grid Failure Statistics 2026: Outage Duration, Causes, and Risk

The latest verified grid failure data points to a more fragile U.S. grid. In 2024 the average U.S. outage lasted about 5.6 hours, and major outages rose roughly 64% in the 2010s compared with the 2000s. Weather caused about 80% of major U.S. outages from 2000 to 2023. See emergency power statistics 2026 for backup power trends tied to these numbers. A 5.6-hour average outage may sound manageable until it hits a refrigerator or medical device. Food safety timelines shift quickly after four hours without refrigeration, and critical home medical equipment often needs continuous power. That turns a half-day grid failure into a larger planning problem. Homeowners should look at the average as a baseline, not a worst-case scenario. See how long does food last without power for the food safety clock. ...

August 16, 2026 · 4 min · Jarrod Gravison